Legend
To display the chart's legend, just call graph.getLegendRenderer().setVisible(true);. You can customize the legend's width and position or alignment.
The title and color that will be used for the series description is the title and color from the series objects.
See BaseSeries#setTitle and BaseSeries#setColor.
Position: By default the legend has a horizontal alignment to the right. The vertical alignment can be set via #setAlign (TOP, MIDDLE, BOTTOM). It is also possible to set a specific position via absolute coordinates via #setFixedPosition(x, y).
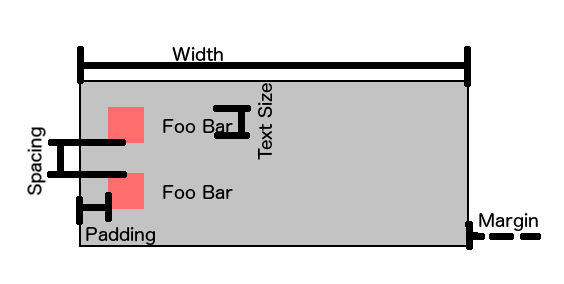
Other options/styles that can be customized:
-
setTextColor
-
setTextSize
This will also change the size of the colored shape.
-
setAlign
-
setBackgroundColor
-
setMargin
-
setPadding
-
setSpacing
-
setWidth
-
setVisible
Here is an example:
GraphView graph = (GraphView) findViewById(R.id.graph);
LineGraphSeries<DataPoint> series = new LineGraphSeries<>(new DataPoint[] {
    new DataPoint(0, 1),
    new DataPoint(1, 5),
    new DataPoint(2, 3),
    new DataPoint(3, 2),
    new DataPoint(4, 6)
});
graph.addSeries(series);

LineGraphSeries<DataPoint> series2 = new LineGraphSeries<>(new DataPoint[] {
    new DataPoint(0, 3),
    new DataPoint(1, 3),
    new DataPoint(2, 6),
    new DataPoint(3, 2),
    new DataPoint(4, 5)
});
graph.addSeries(series2);

// legend
series.setTitle("foo");
series2.setTitle("bar");
graph.getLegendRenderer().setVisible(true);
graph.getLegendRenderer().setAlign(LegendRenderer.LegendAlign.TOP);