Basics of GraphView
GraphView is a custom View, that can be used to plot diagrams in your Android app. Because it extends the base View class of Android, you can use it like any other View in your layout. You can create simple graphs completely declarative in the layout XML file, or create more complex graphs programmatically in your Java code.
Here is an important overview of the GraphView components:
The Series class is used to fill the graph with data. One Series contains the data points of one "line", that will be plotted as a line, points or bars. Simple Graphs only have one series, but you can add several series to GraphView. You choose a subclass of Series in order to define the type of your graph (LineGraphSeries, PointsGraphSeries, BarGraphSeries).
Add a series to the Graph via GraphView.addSeries(series);
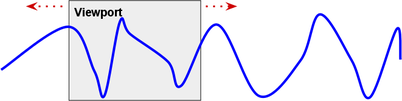
The viewport defines the part that is currently visible. By default the viewports syncs automatically with the data, so that the whole data can be plotted. It also will define nice-looking bounds, so that the min/max labels have rounded numbers. It is possible that you have a large set of data but only want to show a part of it. You can specify a fixed size of the viewport that is visible. It also handles scrolling and zooming/scaling if it is activated.
To activate scaling and zooming use this methods:
// activate horizontal zooming and scrolling
graphview.getViewport().setScalable(true);

// activate horizontal scrolling
graphview.getViewport().setScrollable(true);

// activate horizontal and vertical zooming and scrolling
graphview.getViewport().setScalableY(true);

// activate vertical scrolling
graphview.getViewport().setScrollableY(true);
To set a fixed manual viewport use this:
// set manual X bounds
graph.getViewport().setXAxisBoundsManual(true);
graph.getViewport().setMinX(0.5);
graph.getViewport().setMaxX(3.5);

// set manual Y bounds
graph.getViewport().setYAxisBoundsManual(true);
graph.getViewport().setMinY(3.5);
graph.getViewport().setMaxY(8);The GridLabelRenderer is responsible for the generation of the vertical and horizontal labels and the grid lines. You can change the count of the labels, color and much more. The most important methods are:
- graph.getGridLabelRenderer().setNumVerticalLabels / setNumHorizontalLabels
- graph.getGridLabelRenderer().setVerticalAxisTitle / setHorizontalAxisTitle
- for more information read the article about the Style options.